When Will Housing Costs Feel “Normal” Again? Redfin’s Timeline for 46 U.S. Metros
When Will Housing Costs Feel “Normal” Again? Redfin’s Timeline for 46 U.S. Metros
Housing affordability has been strained for years, but a new Redfin analysis shows that a return to 2018-style “normal” costs is closer in some markets than others—if mortgage rates ease and local prices and incomes move in the right direction.
Redfin defines “normal” as the share of median household income needed for a typical monthly mortgage payment in August 2018, when that figure was about 30% nationally. The report looks at 46 large metros under different rate and price-growth scenarios. Redfin is clear that these are hypothetical illustrations, not forecasts.
National Outlook: Rates and Price Growth Matter
Assuming home prices rise at Redfin’s projected 2.1% annually, here’s roughly how long it could take for the U.S. overall to return to 2018 affordability levels:
- 6% mortgage rates + flat prices: February 2029
- 6% rates + 2.1% annual price growth: Within about five years
- 7.5% rates + flat prices: Around 2032
- 7–8% rates + 2.1% price growth: 10 years or more
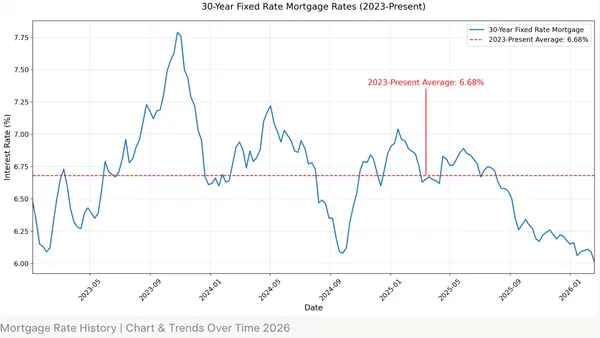
Redfin notes the first and last scenarios are less likely. Current rates are around 7.5%.
West Coast and Austin Lead the Way
Four West Coast metros plus Austin, Texas, are closest to “normal.” Prices are falling in all five, while Redfin projects solid income growth (roughly 4.9–6.5% annually). That combination accelerates the timeline.
Here’s when each market could return to its August 2018 affordability level at different mortgage rates:
| Metro | 8% | 7.5% | 7.25% | 7% | 6.5% | 6% |
|---|---|---|---|---|---|---|
| San Jose | March 2028 | October 2027 | July 2027 | April 2027 | November 2026 | Now |
| Austin | August 2028 | February 2028 | December 2027 | September 2027 | March 2027 | Now |
| Oakland | November 2028 | April 2028 | December 2027 | September 2027 | January 2027 | Now |
| Seattle | December 2029 | June 2029 | April 2029 | January 2029 | July 2028 | January 2028 |
| Portland, OR | November 2030 | February 2030 | October 2029 | June 2029 | September 2028 | December 2027 |
At today’s rates near 7.5%, San Jose could be back to 2018 levels by October 2027. Drop rates to 6%, and San Jose, Austin, and Oakland would already be at “normal” today.
The next-fastest markets at a 7.5% rate include San Antonio (January 2031), Sacramento (April 2031), Denver and Los Angeles (both June 2032), and Fort Worth (February 2033).
“It may seem counterintuitive that housing costs could return to normal sooner in the country’s most expensive markets than in a place like Chicago or Philly, but it comes down to the direction of home prices and incomes,” said Redfin Senior Economist Asad Khan. “In parts of the West, home prices are falling while we expect incomes to keep rising, gradually bringing the markets back to a baseline.”
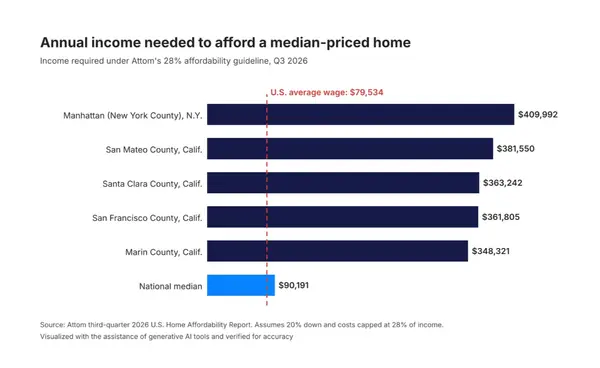
Even a return to 2018 levels wouldn’t make the typical home affordable for the median household in San Jose, Oakland, or Seattle—those markets already required more than 30% of income in 2018.
Markets That Face a Longer Wait
Twenty-four metros, including New York, Chicago, and Philadelphia, would need at least a decade to reach “normal” at any rate between 6% and 8% if local price growth continues. In Chicago, for example, prices are up 5.5% year-over-year while projected income growth is only about 3.9%.
San Francisco is a special case. Housing costs had already returned to 2018 levels in mid-September when rates were around 7.25%. At 7.5% or 8%, however, the metro would take at least a decade. Prices there are up 9.7% year-over-year—Redfin links this partly to AI-driven wealth—while incomes are projected to grow a strong 7.7% annually.
Key Assumptions and Takeaways
Redfin’s projections assume a 20% down payment, current local price trends, and income growth based on Census data from 2015–2019.
Bottom line: Falling rates help everywhere, but markets with declining prices and rising incomes (especially parts of the West Coast and Austin) can return to 2018 affordability far sooner than cities where prices are still climbing faster than incomes. A 6% rate environment would bring immediate relief to San Jose, Austin, and Oakland; sustained higher rates push most of the country into multi-year or decade-long waits.
This analysis highlights how sensitive affordability remains to the interplay of mortgage rates, home-price direction, and local income growth.
Categories
Recent Posts